61 Key Metrics Every Real Estate Business Should Track to Grow


Key metrics every real estate business should track to grow
Table of Contents
Serious about growing your business? Let’s plan exactly how to get you more leads, sales, and results—faster.
These are your topline numbers. They tell you how much revenue your business is bringing in, how profitable your transactions are, and how well your agents are performing financially.
If you’re not tracking these 5 sales metrics, you’re likely overestimating growth and underestimating leaks.
What gets measured… gets multiplied.
Most real estate business owners track closings. Some track commission.
But only a few track what actually drives predictable growth — across sales, team performance, lead quality, retention, and market share.
That’s why the top 1% of agencies don’t just work harder — they measure smarter.
In this guide, we’re going far beyond “vanity” metrics like GCI or monthly sales volume.
We’re unpacking 64 strategic, needle-moving metrics every real estate business should track — and more importantly, how to use them to unlock faster growth, higher profitability, and stronger operational control.
Whether you’re a solo founder scaling past £1M or leading a multi-agent team ready for aggressive expansion, this guide will help you unleash-
- Sales & Revenue Performance Metrics
- Lead Generation & Pipeline Health
- Funnel Conversion Metrics
- Agent Productivity & Performance
- Listing & Market Metrics
- Financial Performance Metrics
- Operational Efficiency Metrics
- Portfolio & Market Metrics
- Risk Metrics
- Mindset & Founder-Led Metrics
Let’s begin.
Marketing Research & Strategy
We help you understand your market and build smart strategies to attract more customers and grow faster.
- Detailed research into your competitors, customers, and market
- Custom marketing and growth plans that drive real results
- Clear action steps to increase traffic, leads, and sales


ADWORDS ROI

Cut Ad spend

What are Real Estate Metrics?
Real estate metrics are quantifiable data points that help you understand how your business is performing across different areas — from lead generation to listings, sales to retention, agent productivity to profitability.
Think of them as your scoreboard.
They help you identify what’s working, what’s not, and what needs attention.
For example:
- “Time to First Contact” tells you how responsive your team is to new leads.
- “Funnel Drop-Off Rate by Stage” shows the percentage of leads that fail to move from one step to the next in your sales funnel.
- “Profit per Transaction” reveals whether you’re actually making money or just chasing top-line growth.
Metrics bring objectivity to decision-making.
Without them, you’re flying blind, making guesses instead of moves.
What are real estate KPIs?
KPIs (Key Performance Indicators) are a subset of your metrics — the ones most directly tied to your business goals.
- If your goal is to increase revenue by 30%, your GCI, average commission per sale, and CLTV become crucial KPIs.
- If your goal is to improve agent performance, monthly production, deal velocity, and agent profitability matter most.
In short:
All KPIs are metrics, but not all metrics are KPIs.
KPIs act as your business GPS. They keep your entire team focused on what moves the needle.
Why are real estate metrics important?
Most agencies don’t fail because of a lack of leads or effort.
They fail because they don’t know what’s really happening inside the business.
- Are your ads driving leads, but your agents aren’t converting?
- Is your top agent actually your most expensive, profit-wise?
- Are you spending £2,000 to acquire a client worth only £1,800?
Metrics reveal these gaps.
Here’s what effective metric tracking unlocks:
- Smarter marketing: Know which channels bring high-converting leads
- Better hiring & training: Coach your agents based on real performance gaps
- Higher profitability: Spot where money is leaking before it’s too late
- Faster scale: Build predictable systems that replicate results
When you’re armed with the right metrics, every decision becomes easier — and more profitable.
Masterlist….64 Key Metrics Every Real Estate Business Should Track
Sales & Revenue Performance Metrics
These are your topline numbers. They tell you how much revenue your business is bringing in, how profitable your transactions are, and how well your agents are performing financially.
If you’re not tracking these 5 sales metrics, you’re likely overestimating growth and underestimating leaks.
1. Total Gross Commission Income (GCI)
What is it (for you)?
It’s the total commission your real estate business earns from all transactions — before any splits, fees, or deductions. Think of it as your raw income.
(Quick note: “Splits” often refer to the portions of commission shared with agents, brokers, or franchise partners.)
Why it matters to you:
Your GCI is the heartbeat of your business. It powers your cash flow, pays your agents, and fuels future growth. If you’re tracking performance, GCI is the number that shows whether you’re moving forward or stalling.
Your Formula:
Total Gross Commission Income = Total Sales Volume × Average Commission Rate
Where:
- Total Sales Volume = The total value of all properties you’ve sold (or deals closed)
- Average Commission Rate = The typical % you earn per transaction
(Keep in mind: Commission rates often vary — e.g., buyer vs. seller sides, negotiated deals, or tiered structures.)
Example:
Let’s say you closed £10,000,000 in property sales and your average commission is 2.5%
GCI = £10,000,000 × 2.5% = £250,000
Pro Tip (Don’t miss this):
It’s easy to celebrate rising GCI — but don’t let big numbers fool you. Always check your profit margins. High GCI with high operating costs can still leave you underwater. Revenue means nothing if it doesn’t stick.
2. Average Commission per Sale
What is it (for you)?
It’s the average amount of commission you earn from each closed deal, regardless of the size or type of transaction.
Why it matters to your business:
Not every deal pays the same. Some areas, some clients, and some property types bring in higher commissions. This metric helps you see the true value of each transaction, beyond just volume.
Formula:
Average Commission per Sale = Total Gross Commission Income ÷ Number of Sales
Where:
- Total Gross Commission Income = All commissions earned from closed/completed deals
- Number of Sales = Total number of completed transactions
Example:
If your agency earned £250,000 in total commission from 50 sales:
£250,000 ÷ 50 = £5,000
So you’re earning an average of £5,000 per deal.
Real Insight:
A growing number of sales can look like growth… But if your average commission per sale is dropping, you’re doing more work for less reward. Track this metric closely — it protects your profit per effort.
3. Commission per Agent
What is it (for you)?
It’s the average amount of commission each agent on your team brings in, whether you’re tracking monthly, quarterly, or annually.
Why it matters to your team’s growth:
This is one of the clearest ways to see who’s driving revenue — and who might need support, coaching, or a shift in responsibilities. It helps you move from guessing to leading with data.
Formula:
Commission per Agent = Total Gross Commission Income ÷ Number of Active Agents
Where:
- Total GCI = Total gross commission income attributable to or earned by the agents in your agency during the specified period.
(This ensures you’re measuring the portion relevant to agent performance, not the agency’s total top-line revenue before splits or other allocations.)
- Number of Active Agents = Only those who contributed to sales in that period
Example:
Let’s say you earned £300,000 in total commission and had 10 active agents:
£300,000 ÷ 10 = £30,000 per agent
That’s your benchmark for agent productivity, structuring incentives, and forecasting revenue.
Digital Marketing, SEO & PPC
- SEO to boost rankings and capture high-intent, AI-driven traffic
- Performance Marketing to run ROI-focused campaigns that convert
- Content Marketing to drive clicks, earn links, and build authority

4. Number of Transactions Closed
What is it (for you)?
It’s the total number of deals your agency has closed in a specific time period — monthly, quarterly, or annually.
Why it matters to your growth strategy:
This is your deal volume metric — a key driver of your GCI, agent workload, and how scalable your operations really are. If you want predictable growth, this is one number you need to track like clockwork.
The Number of Transactions Closed is typically a direct count of all deals finalised within the specified period.
Alternatively, if you don’t have exact transaction data readily available, you can estimate it using:
Formula:
Number of Transactions Closed = Total Gross Commission Income ÷ Average Commission per Sale
Where:
- Total GCI = All commissions earned
- Avg. Commission per Sale = What you typically make per closed deal
Example:
If you’ve earned £240,000 in commission and your average per-deal commission is £6,000:
£240,000 ÷ £6,000 = 40 transactions
That’s your total deal count — even if you don’t have exact transaction data on hand.
Pro Tip:
Don’t just chase more transactions.
More deals ≠ more profit if each one brings in less and drains your resources.
Always pair this with metrics like Average Commission per Sale and Profit per Transaction to make sure every closing actually moves your business forward.
5. Pending Commission Value
What is it (for you)?
It’s the total commission you’re expecting to earn from deals that are under contract, but haven’t closed yet. In other words, income that’s on its way, but not in your pocket just yet.
Why it matters to your next quarter:
This number is your revenue pipeline. It gives you a forward-looking view of what’s coming, so you can forecast income, set expectations, and make smarter decisions around spending, hiring, or reinvestment.
Your Formula:
Pending Commission Value = Total Value of Deals Under Contract × Average Commission Rate
Where:
- Total Value of Deals Under Contract = All agreed-upon but not-yet-closed property sales
- Average Commission Rate = What you typically earn per deal
Example:
Let’s say you have £5,000,000 worth of pending deals and your average commission is 2%:
£5,000,000 × 2% = £100,000 in pending commission
That’s income almost in your hands, and crucial for short-term planning.
Important Note:
Pending commission is powerful, but don’t treat it as guaranteed.
Deals can fall through, timelines can slip.
Always factor in your fall-through rate and average time-to-close to keep your forecasts grounded in reality.
Lead Generation & Pipeline Health
6. Number of Leads Generated (by Source)
What is it (for you)?
It’s the total number of new leads you’re attracting, broken down by where they came from: SEO, paid ads, email, social media, referrals, listing portals, and more.
Why it matters to your marketing ROI:
Not all leads are created equal.
Some come in hot, ready to act. Others? Time-wasters.
When you track lead sources properly, you’ll stop wasting budget on dead-end channels — and double down on the ones actually filling your pipeline with serious buyers or sellers.
Common Lead Sources to Track:
- Organic Search (SEO)
- Paid Ads (Google Ads, Meta, etc.)
- Referrals
- Email Campaigns
- Social Media
- Direct Traffic
- Events & Webinars
- Listing Portals (e.g. Rightmove, Zoopla)
Example (from CRM data):
Let’s say you generated 1,000 leads last month. Your CRM shows:
- 400 from Google Ads
- 250 from SEO
- 150 from referrals
- 100 from social
- 100 from email campaigns
Now you know where to invest, where to optimise, and what to reconsider in your marketing mix.
Pro Insight:
Don’t get distracted by volume alone.
Your best lead source is the one that brings in qualified leads that convert, not just the most names in your CRM.
Example,
If your CRM shows 500 total leads last month, and you break it down like this:
- Organic Search: 150 leads
- Paid Ads: 120 leads
- Social Media: 80 leads
- Referrals: 50 leads
- Email: 60 leads
- Events: 40 leads
Then:
| Source | Leads | % of Total |
|---|---|---|
| Organic Search | 150 | 30% |
| Paid Ads | 120 | 24% |
| Social Media | 80 | 16% |
| Referrals | 50 | 10% |
| 60 | 12% | |
| Events/Webinars | 40 | 8% |
Marketing Research & Strategy
We help you understand your market and build smart strategies to attract more customers and grow faster.
- Detailed research into your competitors, customers, and market
- Custom marketing and growth plans that drive real results
- Clear action steps to increase traffic, leads, and sales
ADWORDS ROI
Cut Ad spend
7. Cost per Lead (CPL)
What is it (for you)?
It’s how much you’re spending to bring in one lead from a specific marketing channel, like Google Ads, Facebook, SEO, or email campaigns.
Why it actually matters:
A low CPL is great, but only if those leads convert into customers. High CPLs with poor conversions are even worse, draining your budget without results.
Tracking CPL helps you figure out where your marketing is efficient — and where it’s silently bleeding your budget.
Your Formula:
Cost per Lead (CPL) = Total Marketing Spend ÷ Number of Leads Generated
Where:
- Total Marketing Spend = What you spent on a specific platform or campaign
- Number of Leads Generated = Leads directly attributed to that spend
Example:
Let’s say you spent £2,000 on Facebook Ads and pulled in 80 leads:
£2,000 ÷ 80 = £25 per lead
Now, imagine your Google Ads CPL is £40, but converts better.
That insight lets you invest smarter, not just cheaper.
Pro Insight:
Always track CPL per channel — never in aggregate.
One platform might flood you with leads, while another gives you fewer but better ones.
The goal isn’t the cheapest lead — it’s the most profitable one.
8. Lead-to-Client Conversion Rate
What is it (for you)?
It’s the percentage of your leads that actually turn into paying clients.
In short, how many people who showed interest actually did business with you?
Why it matters (a lot):
This is the ultimate reality check for both your marketing and sales processes.
If you’re generating tons of leads but barely closing deals, you don’t have a traffic problem…
You’ve got a conversion problem.
Formula:
Lead-to-Client Conversion Rate (%) = (Number of Clients ÷ Number of Leads) × 100
Where:
- Number of Clients = Leads who actually converted into paying customers
- Number of Leads = All leads generated in that same period
Example:
You brought in 500 leads and closed 45 deals:
(45 ÷ 500) × 100 = 9% Conversion Rate
Now you know 1 in every ~11 leads turns into a client — a crucial number for forecasting revenue and scaling.
9. Time to First Contact (Speed to Lead)
What is it (for you)?
It’s the average time it takes you or your team to follow up with a new lead, from the moment they fill out a form, send a message, or call in.
Why it matters (a lot):
Leads go cold fast.
Research shows that if you contact a lead within 5 minutes, you’re 100x more likely to convert than if you wait an hour.
In real estate, the first one to respond is often the one who wins the deal.
Formula:
Time to First Contact = First Contact Timestamp – Lead Capture Timestamp
Where:
- Lead Capture Timestamp = When the lead comes in (form filled, call made, CRM entry)
- First Contact Timestamp = When your team reaches out (call, text, email, DM — whatever comes first)
Example:
Lead captured at 10:00 AM
First contact at 10:04 AM
Response time = 4 minutes. That’s decent.
10. Appointment Set vs. Attended Ratio
What is it (for you)?
It’s the percentage of scheduled property appointments — calls, meetings, or viewings — that actually happen.
Why it matters:
Setting appointments feels like progress.
But if leads don’t show up, your pipeline stalls and your agents waste valuable time.
This metric reveals how well you’re qualifying leads, managing reminders, and setting the right expectations.
Formula:
Appointment Attendance Rate (%) = (Appointments Attended ÷ Appointments Set) × 100
Where:
- Appointments Set = All scheduled meetings, calls, or property viewings
- Appointments Attended = Those that actually happened with the lead/client
Example:
You scheduled 100 appointments last month. But 78 attended.
(78 ÷ 100) × 100 = 78% attendance rate
That’s decent, but if 22% didn’t show, you’re leaking time and sales energy.
Digital Marketing, SEO & PPC
- SEO to boost rankings and capture high-intent, AI-driven traffic
- Performance Marketing to run ROI-focused campaigns that convert
- Content Marketing to drive clicks, earn links, and build authority
11. Profit per Transaction
What is it (for you)?
It’s the actual profit you make from each closed deal — after subtracting the real business costs it took to make that sale happen.
Why it really matters:
It’s not the sale price that builds your business — it’s what’s left after the dust settles.
You could be closing more deals than ever…
But if your profit per transaction is shrinking, your growth is just an illusion.
Formula:
Profit per Transaction = Revenue per Transaction – Total Costs per Transaction
Where:
- Revenue per Transaction = Gross commission or income earned from the deal (before any splits or internal distributions)
Total Costs per Transaction = All direct and indirect business expenses incurred to generate the sale, including:
- Marketing & advertising
- Admin/transaction coordination
- Legal or compliance costs
- Portal fees
- CRM usage (if per-deal)
- Any incentives or staging costs
Important Note: If you’re paying a portion of the gross commission to an agent (e.g., a commission split), that’s already part of how the revenue is distributed — it should not be added again as a separate cost. The split reduces your retained revenue, but isn’t a business expense incurred to generate that revenue.
Example:
You earned £10,000 in gross commission on a sale
It cost you £2,000 in marketing, admin, and legal support
Profit per Transaction = £10,000 – £2,000 = £8,000
Funnel Conversion Metrics
Getting leads is just the beginning. The real game is in converting them — from stranger to client, step by step.
This section uncovers the metrics that reveal leaks, friction, and hidden opportunities in your funnel.
12. Funnel Drop-Off Rate by Stage
What is it (for you)?
It’s the percentage of leads that fail to move from one step to the next in your sales funnel — whether that’s from clicking an ad to submitting a form, or from booking a call to actually showing up.
Why it really matters:
This is your funnel health check.
It shows you exactly where good leads are slipping through the cracks — so you can stop the leaks and increase conversions without needing more traffic or ad spend.
How you should use it:
- Map your entire funnel, step-by-step:
Leads Captured → Leads Contacted → Leads Qualified → Appointment Set → Appointment Attended → Viewing → Offer Sent → Deal Closed
- Track how many leads move from each step to the next
- Spot the drop-offs — and fix the specific problem:
- Is your copy confusing
- Is your CTA weak?
- Is your follow-up slow or generic?
Formula:
Drop-Off Rate (%) = ((Leads at Previous Stage – Leads at Current Stage) ÷ Leads at Previous Stage) × 100
Example:
500 leads were qualified
Only 300 booked appointments
Drop-Off Rate = ((500 – 300) ÷ 500) × 100 = 40%
That’s 200 warm leads lost at just one stage. Ouch.
Typical Real Estate Funnel Stages to Track:
- Leads Captured
- Leads Contacted
- Leads Qualified
- Appointment Set
- Appointment Attended
- Viewing or Proposal Sent
- Deal Closed
13. Landing Page Conversion Rate
What is it (for you)?
It’s the percentage of people who visit your landing page and actually take action, like filling out a form, booking a call, or requesting a property viewing.
Why it matters (big time):
This one metric tells you whether your page is working or burning your budget.
You could be sending tons of traffic from SEO, Google Ads, or socials…
But if your landing page doesn’t convert, you’re just lighting money on fire.
How you should use it:
- Track conversion rates for every landing page, offer, and traffic source
- Run A/B tests on:
- Headlines
- CTAs
- Form length
- Testimonials
- Visuals
Formula:
Landing Page Conversion Rate (%) = (Number of Conversions ÷ Number of Visitors) × 100
Where:
- Conversions = People who completed your goal action (form filled, call booked, etc.)
- Visitors = Unique visitors to that page in the same time frame
Example:
Your landing page got 2,000 visits
150 people filled out your lead form
Conversion Rate = (150 ÷ 2,000) × 100 = 7.5%
That’s decent, but could likely be pushed higher with small tweaks.
How to Improve Conversion Fast:
- Make your headline clear & benefit-driven — no clever fluff
- Stick to one strong CTA — don’t confuse people
- Use social proof — testimonials, reviews, trust logos
- Make it mobile-friendly — most users are browsing on phones
- Reduce friction — fewer fields = more form fills
- Match the message to the traffic source — don’t bait and switch
- Speak to outcomes, not just features — show what they get, not what you do
14. Retargeting Conversion Rate
What is it (for you)?
It’s the percentage of people who converted after seeing your retargeting ads — whether on Facebook, Google Display, YouTube, or Instagram.
Why it matters (more than you think):
Most leads don’t convert the first time they visit your site.
Retargeting gives you a second chance to win them back — and done right, it can double your ROI without increasing traffic spend.
Formula:
Retargeting Conversion Rate (%) = (Conversions from Retargeting Ads ÷ Clicks from Retargeting Ads) × 100
Where:
- Conversions = Form fills, bookings, or purchases resulting from your retargeting ad
- People Reached = Unique users (not impressions) who saw the ad
Example:
Let’s say 1,200 people saw your retargeting ad, and 96 converted:
(96 ÷ 1,200) × 100 = 8% Retargeting Conversion Rate
That’s solid, especially if your cold traffic is converting under 3%.
Conversion Uplift Hack:
Stack multiple trust-building elements in your retargeting ads:
- Client testimonials
- Property walkthroughs or demo videos
- Case studies or results
This layered approach rebuilds confidence and makes it easier for them to say “yes.”
Tips to Boost Retargeting Results:
- Use dynamic retargeting based on past behavior — show the exact property or service they viewed
- Add urgency: “Only 2 units left” or “Offer ends Friday”
- Test different time windows — 1–7 days works best for warm leads, while 14–30 days can re-engage cooler ones
- Align your ad message with the landing page content — consistency builds trust
Marketing Research & Strategy
We help you understand your market and build smart strategies to attract more customers and grow faster.
- Detailed research into your competitors, customers, and market
- Custom marketing and growth plans that drive real results
- Clear action steps to increase traffic, leads, and sales
ADWORDS ROI
Cut Ad spend
Agent Productivity & Performance
Your agents are the engine of your business. But not all engines perform equally.
These metrics go beyond surface-level “sales volume” and reveal true agent contribution, efficiency, and growth potential.
15. Monthly Production per Agent
What is it (for you)?
It’s the average value of closed transactions per agent in a given month — your clearest snapshot of individual performance and team productivity.
Why it really matters:
This number gives you insight into:
- Who’s consistently producing
- Where your training efforts are paying off
- Which agents might be falling behind
- And whether your operational costs are actually earning their keep
Tracking this monthly (and YoY) helps you catch seasonal trends, measure agent growth, and flag underperformance early, before it becomes a bigger issue.
Your Formula:
Monthly Production per Agent = Total Sales Volume for the Month ÷ Number of Active Agents
Where:
- Total Sales Volume = Combined value of all closed transactions that month
- Active Agents = Only agents who closed at least one deal during that period
Example:
You closed £3,000,000 in sales last month
6 agents were active
£3,000,000 ÷ 6 = £500,000 per agent
That’s your monthly production benchmark — and a key driver for compensation, lead allocation, and coaching decisions.
Warning Sign:
Agents who aren’t closing still cost your business, through:
- CRM seats
- Marketing and lead distribution
- Management time
- And long-term brand impact
If they’re not producing, they’re pulling profit away from your growth.
This metric gives you the clarity and confidence to make those tough—but—necessary calls.
16. Deal Velocity (Lead-to-Close Time)
What is it (for you)?
It’s the average number of days it takes an agent to go from first contact with a lead to a closed deal.
In other words: how fast are you turning conversations into commissions?
Why it matters:
In real estate, speed = revenue.
A slow deal cycle clogs your pipeline, delays commissions, and lowers team morale.
A faster one? It fuels cash flow, builds momentum, and makes your entire business more efficient.
Your Formula:
Deal Velocity = Date of Deal Closure – Date of Initial Lead Capture
Where:
- Initial Lead Capture = When the lead first entered your CRM (form fill, call, ad click, etc.)
- Deal Closure = When the contract was signed or the sale was finalised
Example:
Lead captured on March 1
Deal closed on April 10
Deal Velocity = 40 days
That means it takes you roughly 40 days to turn a lead into revenue — a crucial number for cash flow planning.
How to Speed It Up:
- Qualify leads better upfront — cut the tyre-kickers early
- Automate follow-ups and use CRM nudges — speed kills hesitation
- Prep your agents with ready-made listing/buyer packets — less waiting, more closing
Pro Tips:
- Track velocity by lead source — paid leads may close slower than referrals
- Shorter deal cycles often mean better systems and more motivated buyers
- If deal size is shrinking while speed increases, balance efficiency with value
17. Showings-to-Contract Ratio
What is it (for you)?
It’s the percentage of property showings that result in a signed offer.
In other words: how many viewings does it take before someone says, “I’ll take it”?
Why it matters:
This metric shows how well your agents:
- Qualify buyers before showings
- Match people with the right listings
- Present properties persuasively on the spot
If your team is doing tons of showings but closing very few, it’s a clear signal that something’s broken — either in buyer fit, pricing, or the sales pitch.
Your Formula:
Showings-to-Contract Ratio (%) = (Contracts Signed ÷ Property Showings) × 100
Where:
- Property Showings = In-person or virtual tours conducted
- Contracts Signed = Deals that progressed to signed offers after those showings
Example:
Your team conducted 40 showings last month
8 resulted in contracts/ signed offers
(8 ÷ 40) × 100 = 20%
That means 1 in 5 showings led to a signed deal — a strong signal of good qualification and sales alignment.
Why this metric is powerful:
- It reveals buyer intent and agent effectiveness
- Helps uncover if you’re showing the wrong homes to the wrong people
- Flag issues like:
- Overpriced listings
- Poor buyer fit
- Weak sales presentation
Watch Out:
If you see lots of showings but low conversion, it likely means:
- Weak buyer pre-qualification
- Unfocused showings
- Agents failing to guide the decision
Bottom Line:
Every showing costs you time, energy, and operational bandwidth.
Make sure they’re moving the needle, not just keeping your calendar full.
18. Follow-Up Speed (Initial Response Time)
Your Formula:
Follow-Up Speed = First Follow-Up Time – Lead Capture Time
Example:
Lead comes in at 2:00 PM
Agent follows up at 2:06 PM
Follow-Up Speed = 6 minutes
Example:
You followed up with a lead 14 times over a week =
Follow-Up Frequency = 14 ÷ 7 days = 2
Pro Tips to Improve Both:
- Set up instant lead alerts via CRM, text, or app
- Use automated drip sequences to stay top-of-mind
- Personalise every follow-up — mention what they asked, viewed, or wanted
- Role-play with agents to improve speed and handling
Reminder:
Most deals close after 11+ touches — across calls, emails, texts, or DMs.
So if your team’s giving up after 2 or 3, you’re leaving serious money on the table.
19. Follow-Up Frequency
What is it (for you)?
This means how many times have you followed up before giving up.
Why it matters:
Fast, consistent follow-up = more deals closed.
Slow or lazy follow-up? That’s money walking out the door.
Studies show that responding within 5 minutes drastically increases your chances of conversion. And most deals? They happen after 8–12 touches.
Digital Marketing, SEO & PPC
- SEO to boost rankings and capture high-intent, AI-driven traffic
- Performance Marketing to run ROI-focused campaigns that convert
- Content Marketing to drive clicks, earn links, and build authority
20. Agent Profitability (Not Just Revenue)
What is it?
Revenue generated by an agent minus their cost to the business (tools, training, commissions, support).
Why it matters:
Sales volume ≠ profit.
An agent can close £2M in sales but costs more than they bring in. This metric keeps your growth sustainable.
How to use it:
- Track commissions, software usage, and admin support required
- Compare cost vs contribution
- Rank agents by net profitability, not just GCI
Formula:
Agent Profitability = Gross Commission Generated by Agent – (Agent-Related Costs)
Where:
Gross Commission Generated by Agent: The total commission generated from the sales an agent closes, before any splits are paid out to the agent. This is the direct revenue attributed to that agent’s sales for the business.
Agent-related costs may include:
- Lead generation costs (ads, portal fees)
- Marketing materials (photography, brochures)
- CRM and software usage
- Admin support or transaction coordinator costs
- Office space or desk fees (if applicable)
- Training or coaching expenses
- Commission splits or caps (if the agency pays them)
- Salary/benefits (if salaried)
Listing & Market Metrics
Your listings are your inventory. And how they perform — how long they sit, how many offers they attract, how close they sell to asking — gives you sharp insight into market positioning, agent skill, and pricing strategy.
21. Days on Market (DoM)
What is it (for you)?
It’s the average number of days a property stays listed before going under contract, sold, or withdrawn.
It tells you how fast (or slow) your listings are moving — and where friction might be hiding.
Why it really matters:
Days on Market is your silent performance report.
- A long DOM can reveal overpricing, weak listing quality, or agents failing to follow up.
- A short DOM usually means you’ve nailed the pricing, marketing, or buyer targeting.
Your Formula:
Days on Market (DoM) = Listing End Date – Listing Start Date
Where:
- Listing Start Date = The date the property went live publicly
- Listing End Date = The date it was marked as sold, under offer, or withdrawn
Example:
Property listed on May 1
Sold on June 12
DoM = 42 days
That’s 42 days of marketing.
Why This Metric Really Matters:
Short DoM often signals:
- Competitive pricing
- High buyer demand
- Strong marketing or agent follow-up
Long DoM may signal:
- Overpriced listings
- Low-quality photos or weak descriptions
- Passive agents
- Poor timing or market saturation
22. List Price vs. Sale Price Ratio
What is it?
The final sale price of a property compared to its original list price.
Why it matters:
Shows pricing accuracy and negotiation skills.
Too large a gap = poor pricing or weak sales skills. Too narrow a gap (in a hot market) = money left on the table.
Formula:
List-to-Sale Price Ratio (%) = (Final Sale Price ÷ Original List Price) × 100
Where:
- Final Sale Price = Actual closing price of the property
- Original List Price = The price at which the property was initially listed
Example:
Original List Price = £500,000
Final Sale Price = £480,000
List-to-Sale Price Ratio = (480,000 ÷ 500,000) × 100 = 96%
This means the property sold for 96% of the asking price.
Why This Metric Matters:
Measures pricing accuracy and negotiation strength
High ratio (close to or above 100%) = strong market or well-priced listing
Low ratio = overpricing, poor marketing, or weak negotiation
23. Number of Offers per Listing
What is it (for you)?
It’s the average number of offers each listed property receives before going under contract, whether verbal, written, or formal.
Why it really matters:
High offer count =
- Strong listing visibility
- High buyer interest
- Well-matched targeting
Low offer count =
- Poor photos or uninspiring listing copy
- Weak follow-up or low ad visibility
- Off-market timing or poor agent match
Your Formula:
Average Offers per Listing = Total Number of Offers Received ÷ Total Number of Listings
Where:
- Total Number of Offers = All buyer offers received during a specific period
- Total Listings = All actively listed properties during that same timeframe
Example:
80 offers received across 25 listings =
80 ÷ 25 = 3.2 offers per listing
That means you’re averaging just over 3 offers per property — a sign of healthy buyer demand.
Marketing Research & Strategy
We help you understand your market and build smart strategies to attract more customers and grow faster.
- Detailed research into your competitors, customers, and market
- Custom marketing and growth plans that drive real results
- Clear action steps to increase traffic, leads, and sales
ADWORDS ROI
Cut Ad spend
24. Total Website Visits
What is it (for you)?
It’s the total number of sessions (visits) to your real estate website over a specific period, showing how many people are exploring your brand, listings, and services online.
Why it really matters:
Website visits aren’t just numbers — they’re signals of interest.
Each visit means someone took the time to check you out. And when tracked properly, it helps you:
- Understand what’s working
- Spot traffic spikes from campaigns or new listings
- Benchmark your growth over time
- Spot seasonal patterns in buyer or investor behavior
Your Formula:
Total Website Visits = Sum of all sessions during a defined time period
Where:
- A session = one continuous visit by a user
- Measured using tools like Google Analytics, HubSpot, Matomo, or Adobe Analytics
Example (Let’s say the below traffic sessions are of July 2025):
| Traffic Source | Sessions |
|---|---|
| Organic Search | 3,800 |
| Google Ads | 2,100 |
| Facebook Ads | 900 |
| Direct Traffic | 1,200 |
| Referral (Portals) | 400 |
Total Website Visits = 8,400
Objectives:
- Track your brand reach and online presence
- Identify which channels are driving the most interest
- Benchmark current performance against past months
- See which pages get the most attention
- Spot seasonal or event-driven traffic shifts (e.g., during a launch or webinar)
25. Customer Acquisition Cost (CAC)
What is it (for you)?
It’s the total cost to acquire one new paying customer, including everything from ads to team salaries.
This isn’t just a marketing number — it’s a profitability checkpoint.
Why it really matters:
You’re not just spending money to get leads — you’re investing to gain actual clients. Tracking CAC tells you if your growth is sustainable or if you’re bleeding cash just to keep deals coming in.
Your Formula:
Customer Acquisition Cost (CAC) = Total Marketing & Sales Spend ÷ Number of New Customers Acquired
Where Marketing & Sales Spend includes:
- Paid ads
- Sales salaries
- Software tools
- Commissions
- Freelancers or agency fees
New Customers Acquired = Number of clients who signed during that time period
Example:
In June, you spent:
£4,000 on marketing
£2,000 on sales tools, salaries, and support
And gained 20 new clients
CAC = (£4,000 + £2,000) ÷ 20 = £300 per customer
Objectives:
- Measure the true cost of every new customer
- Compare CAC vs LTV to ensure profitability
- Test new channels or campaigns using CAC as a benchmark
- Uncover your biggest cost drivers
- Align budgets with actual ROI, not assumptions
26. Number of Properties Advertised per Agent
What is it (for you)?
It’s the average number of active listings each agent is currently managing.
This metric gives you a real-time look at agent workload, focus, and balance, so you’re not flying blind when it comes to productivity.
Why it really matters:
Too many listings? Agents get overwhelmed.
Too few? You’re likely missing out on opportunities.
Tracking this helps you ensure agents are neither overloaded nor underutilised, and allows you to distribute leads, marketing support, and admin resources more effectively.
Your Formula:
Properties per Agent = Total Active Listings ÷ Number of Active Agents
Where:
- Total Active Listings = Properties currently live on the market
- Active Agents = Agents actively managing those listings (exclude dormant/inactive staff)
Example:
Your agency has 60 active listings managed by 10 active agents:
60 ÷ 10 = 6 listings per agent
That’s your current average — a useful benchmark for setting workload expectations or identifying outliers.
Objectives:
- Track agent productivity and balance workloads
- Guide hiring, territory assignments, and delegation
- Ensure lead flow and marketing resources match listing volume
- Avoid burnout and maintain listing quality
27. Client Lifetime Value (CLTV)
What is it (for you)?
It’s the total net profit your business earns from a single client across their entire relationship with you, including repeat purchases, referrals, and upsells.
Why it really matters:
If you know what a client is actually worth, you know exactly how much you can afford to spend to acquire them.
That unlocks your true marketing ceiling — and helps you scale confidently, without guessing.
This is the difference between playing the short game (single sale) and building compounding revenue over the years.
Core Formula (Simple):
CLTV = Average Revenue per Client × Average Client Lifespan
Where:
- Average Revenue per Client = Total income from one client (can be per transaction or annual)
- Average Client Lifespan = How long they stay active or return for new transactions (in years or deal count)
Advanced Formula:
CLTV = (Average Transaction Value × Purchase Frequency × Client Lifespan) × Gross Margin %
Example:
- Average transaction value: £5,000
- The average client does 2 transactions over 3 years
- Gross margin = 60%
CLTV = (£5,000 × 2 × 3) × 0.60 = £30,000 × 0.60 = £18,000
So, each client is worth £18,000 in profit over their lifetime.
Why CLTV Is a Game-Changer:
- Helps you set a profitable Customer Acquisition Cost (CAC)
- Justifies investment in long-term marketing, onboarding, and retention
- Identifies your most valuable client segments (e.g., repeat investors, landlords, developers)
- Sharpens your revenue forecasting and marketing ROI decisions
Digital Marketing, SEO & PPC
- SEO to boost rankings and capture high-intent, AI-driven traffic
- Performance Marketing to run ROI-focused campaigns that convert
- Content Marketing to drive clicks, earn links, and build authority
Financial Performance Metrics
28. Net Operating Income (NOI)
What it is:
The income your property makes after paying all its operating expenses, but before loan payments, taxes, or improvements.
Why it matters:
- Helps compare profitability across different properties
- Used by lenders to assess the ability to cover debt
- Forms the basis for calculating other metrics like the cap rate
- Signals when costs are eroding returns
Objectives:
- Measure the property’s true operating profit
- Evaluate the impact of increasing rents or cutting costs
- Compare the performance of multiple properties
- Inform decisions on refinancing or selling
- Signal when operating costs are too high
Formula:
NOI = Gross Operating Income – Operating Expenses
Example:
Gross Operating Income = £100,000
Operating Expenses = £35,000
→ NOI = £65,000
29. Internal Rate of Return (IRR)
What it is:
The Internal Rate of Return (IRR) is the annualized rate of return at which the Net Present Value (NPV) of all cash flows—both incoming and outgoing—equals zero.
In simpler terms, it answers the question:
“What average annual return will this investment generate over its lifetime?”
Why it matters:
- Accounts for the time value of money: Considers both the size and timing of cash flows, giving more weight to earlier returns.
- Enables apples-to-apples comparison: Useful for evaluating and ranking multiple investment opportunities with different durations and structures.
- Supports decision-making: Helps determine whether an investment meets or exceeds your required rate of return (hurdle rate).
- Guides long-term planning: Useful in capital budgeting and reinvestment strategies.
- Reflects timing impact—not penalization: IRR doesn’t penalize slow or irregular payback. Instead, it reflects how delayed cash flows reduce the overall return due to the time value of money.
Objectives:
Estimate the annualized return over the full life of the investment
Fairly compare projects with different durations and cash flow patterns
Evaluate whether a project meets your required rate of return
Understand how timing (earlier vs. later profits) affects investment performance
Assess deal viability and long-term financial impact
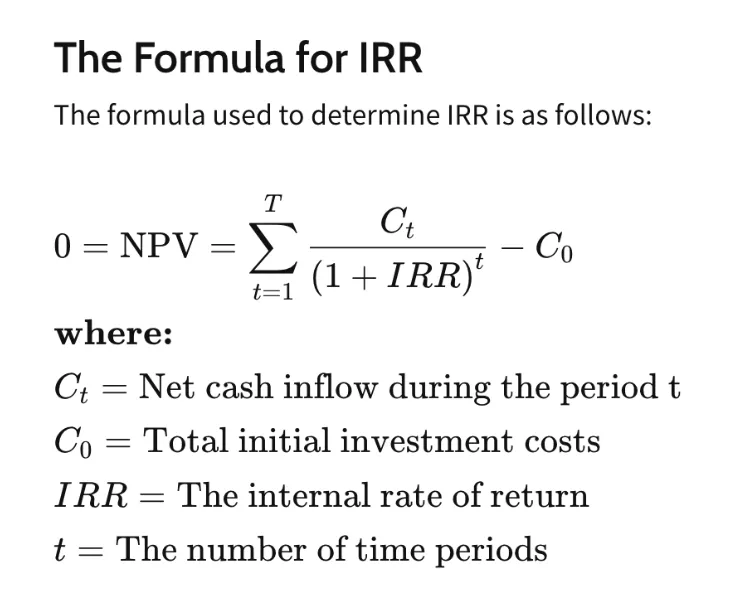
Image Source: investopedia
30. Cash‑on‑Cash Return
What it is:
The percentage of annual pre‑tax cash flow you earn compared to your actual cash investment (down payment, fees).
Why it matters:
- Shows yearly cash yield from your own money
- Helps judge if rental income meets expectations
- Allows comparison between cash‑versus‑financed deals
- Reflects the impact of debt servicing
- Useful for investors relying on regular cash income
Objectives:
- Check short‑term cash performance
- Compare various financing structures
- Understand the impact of mortgage payments
- Identify deals that generate strong cash flow
- Support decisions on reinvestment or distributions
Formula:
Cash-on-Cash Return (%) = Annual Pre-Tax Cash Flow ÷ Total Cash Invested × 100
Example:
Annual Cash Flow = £12,000
Total Cash Invested = £100,000
→ Return = 12%
Pro Tip:
Include all upfront cash—down payment, closing costs, rehab. A high return can still hide weak cash flow if it’s based on a small investment only.
31. Return on Investment (ROI)
What it is:
The overall profit you earn from a property compared to your total cost, expressed as a percentage.
Why it matters:
- ROI considers both the income generated by the property (e.g., rent) and any increase in its market value (price appreciation) over time.
- Easy to compare different investments
- Helps evaluate if a property meets financial goals
- Shows full return beyond just cash flow
- Useful for both cash purchases and leveraged deals
Objectives:
- Evaluate the total profit from a deal
- Compare all-in return across different properties
- Decide whether to reinvest or sell
- Measure the impact of repairs or improvements on the property's value and subsequent profit.
- Benchmark against historical/market returns
Formula:
ROI (%) = (Net Profit ÷ Total Investment Cost) × 100
Example:
Profit = £40,000
Investment = £200,000
→ ROI = 20%
Marketing Research & Strategy
We help you understand your market and build smart strategies to attract more customers and grow faster.
- Detailed research into your competitors, customers, and market
- Custom marketing and growth plans that drive real results
- Clear action steps to increase traffic, leads, and sales
ADWORDS ROI
Cut Ad spend
32. Gross Rent Multiplier (GRM)
What it is:
The Gross Rent Multiplier (GRM) is a simple valuation metric used in real estate to compare the price of a property to its gross annual rental income. It’s a quick and dirty way to get a preliminary sense of a property’s value relative to its income-generating potential.
Why it matters:
- Offers a fast way to screen multiple listings
- Helps eliminate overpriced properties early in the process
- Provides a standardized benchmark across different markets
- Avoids complex calculations when you need a high-level comparison
- Indicates how many years of gross rent would be needed to match the purchase price
Important Note:
A lower GRM typically suggests you’re paying less for each dollar of gross rent—but it does not guarantee a better return. GRM doesn’t account for operating expenses, debt service, or vacancy rates.
A property with a low GRM might still have poor cash flow if its costs are high. Always use GRM as an initial filter, not a final decision metric.
Objectives:
- Quickly assess rental property potential
- Compare properties across different rental markets
- Identify potentially undervalued or overpriced listings
- Shortlist deals for deeper financial analysis
- Create a consistent framework for high-level comparisons across locations
Formula:
GRM = Property Price ÷ Gross Annual Rent
Example:
Price = £500,000
Rent = £50,000/year
→ GRM = 10
Note: Lower GRM = better return (if expenses are equal).
33. Equity Multiple (EM)
What it is:
A measure of total cash received relative to total equity invested over an investment’s life.
Why it matters:
- Shows cumulative return on invested capital
- Easy to understand (“2×” means double your money)
- Useful for comparing total payback across deals
Objectives:
- Evaluate total investor return
- Screen deals with high cash return potential
- Demonstrate investment value to stakeholders
- Compare gross returns across projects
- Support decisions on deal pacing
Formula:
Equity Multiple = Total Cash Received ÷ Total Equity Invested
Example,
Total Cash Received = £300,000
Equity Invested = £100,000
→ EM = 3.0 ( This means you tripled your investment)
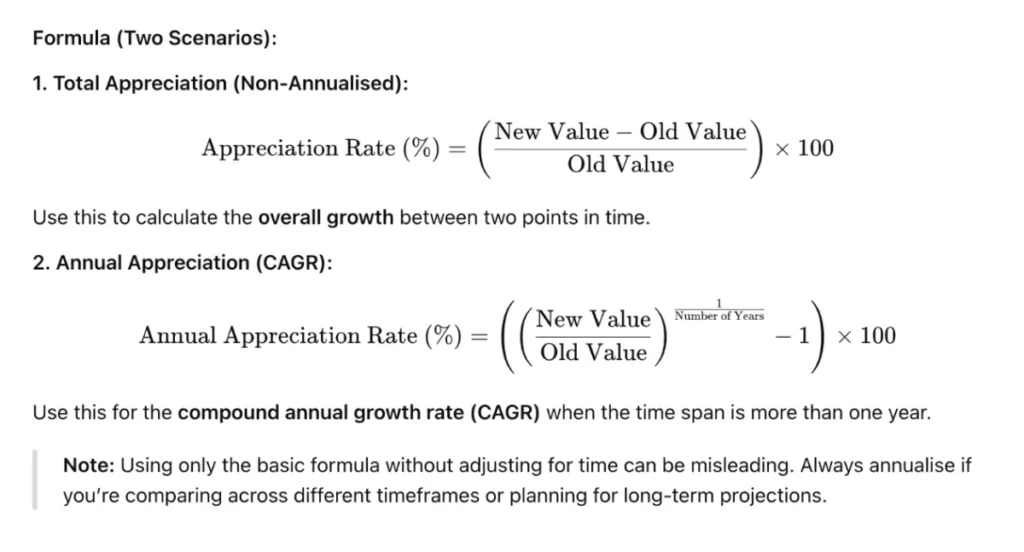
34. Property Appreciation Rate
What it is:
The percentage increase in a property’s value over time—typically used to measure how much its market price grows annually.
Why it matters:
- Reflects local market health
- Boosts total investment return alongside income
- Useful for forecasting long-term asset growth
- Informs decisions on holding vs. selling
- Helps value future refinance or resale timing
Objectives:
- Measure capital growth trends
- Compare growth across locations
- Assess timing for refinancing or sale
- Identify high-growth market areas
- Include appreciation in ROI calculations
Formula:
Digital Marketing, SEO & PPC
- SEO to boost rankings and capture high-intent, AI-driven traffic
- Performance Marketing to run ROI-focused campaigns that convert
- Content Marketing to drive clicks, earn links, and build authority
35. Revenue Growth
What it is:
The year-over-year percentage increase in total income from rent and other sources.
Why it matters:
- Tracks the income trend over time
- Shows if rent increases or new services work
- Helps in budgeting and forecasting
- Indicates business expansion or contraction
- Guides decisions on property upgrades or rent strategy
Objectives:
- Monitor year-over-year growth
- Measure the effectiveness of the rent strategy
- Plan future income and investment
- Identify a drop in income early
- Support operational and strategic planning
Formula:
Revenue Growth (%) = ((Current Period Revenue – Previous Period Revenue) ÷ Previous Revenue) × 100
Pro Tip:
Break it down by income type (rent, parking, fees) to see which sources are growing or lagging.
36. Gross Operating Income (GOI)
What it is:
All income property earnings before expenses—includes rent, parking, laundry, and other fees.
Why it matters:
- Shows total revenue potential
- Forms starting point for NOI
- Helps compare gross income across investments
- Assists in rent modeling
- Useful for spotting missed income opportunities
Objectives:
- Measure the total income from the property
- Identify underused revenue streams
- Benchmark income across properties/seasons
- Support financial forecasting
- Serve as a baseline for NOI and ROI estimates
Formula:
GOI = Potential Rental Income – Vacancy Losses + Other Income
Example:
Potential Rent = £120,000
Vacancy = £10,000
Other Income = £5,000
→ GOI = £115,000
37. Capital Expenditures (CapEx)
What it is:
Money spent by a real estate owner to buy, upgrade, or improve property assets, like replacing a roof or renovating apartments.
Why it matters:
- Extends a property’s useful life
- Enhances asset value and appeal to tenants
- Impacts long-term cash flow and reserves
- Differentiates between routine repairs and major updates
- Affects tax deductions through depreciation
Objectives:
- Plan for long-term improvements and updates
- Maintain competitiveness in the rental market
- Minimise cash surprises through budgeting
- Preserve resale and refinancing options
- Track return on major investments
Formula (basic):
CapEx = Change in Property/ Plant & Equipment + Depreciation
Example:
A real estate company reports the following in its financials:
- Property, Plant & Equipment (PPE) this year: £1,200,000
- PPE last year: £1,000,000
- Depreciation expense this year: £50,000
CapEx = Change in PPE + Depreciation
= (£1,200,000 – £1,000,000) + £50,000
= £200,000 + £50,000
= £250,000
So, the company’s Capital Expenditure (CapEx) for the year is £250,000.
Pro Tip:
Set up a reserve fund monthly to avoid big out-of-pocket CapEx surprises—it smooths financial planning for large expenses.
38. Average Revenue Per Unit (ARPU)
What it is:
Average income earned per rental unit each period—total rental income divided by the number of rental units.
Why it matters:
- Shows revenue strength per unit
- Helps compare performance across properties
- Guides pricing and rent strategy
- Identifies when rent increases or services improve income
- Aids in forecasting and budgeting decisions
Objectives:
- Monitor per-unit income trends
- Detect under-performing units
- Compare performance across properties or markets
- Support rent adjustments with data
- Identify new revenue opportunities per unit
Formula:
ARPU = Total Rental Revenue ÷ Number of Units
Example:
A property management firm earned £120,000 in total rental income from 10 apartments over the year.
ARPU = £120,000 ÷ 10 = £12,000
So, the Average Revenue Per Unit (ARPU) is £12,000 per year.
Marketing Research & Strategy
We help you understand your market and build smart strategies to attract more customers and grow faster.
- Detailed research into your competitors, customers, and market
- Custom marketing and growth plans that drive real results
- Clear action steps to increase traffic, leads, and sales
ADWORDS ROI
Cut Ad spend
Operational Efficiency Metrics
39. Occupancy Rate
What it is:
The percentage of units or space currently rented or occupied out of the total available.
Why it matters:
- Indicates demand and revenue potential.
- Signals vacant space that is losing income.
- Highlights management effectiveness.
- Aids forecasting and planning.
- Reflects tenant satisfaction and retention.
What it helps achieve/evaluate:
- Evaluate property performance.
- Track seasonality and demand trends.
- Benchmark against market averages.
- Plan marketing and leasing efforts.
- Contribute to maximizing rental income.
Formula:
Occupancy Rate (%) = (Occupied Units ÷ Total Units) × 100
Example:
A residential building has 80 occupied units out of 100 total units.
Occupancy Rate = (80 ÷ 100) × 100 = 80%
So, the Occupancy Rate is 80%.
40. Economic Vacancy Rate
What it is:
The income lost due to unoccupied units, rental concessions, and uncollected rent, as a percentage of potential income.
Why it matters:
- Reveals actual revenue loss, not just empty units.
- Shows the impact of concessions or delinquency.
- Guides rent policy and collection efforts.
- Helps budget for income shortfall.
- Tracks tenant payment behaviour.
Objectives:
- Measure the income gap vs. full rent.
- Evaluate revenue impacts of incentives.
- Identify underperforming rent collectors.
- Compare income efficiency by property.
- Forecast more accurate revenue.
Formula:
Economic Vacancy Rate (%) = ((Potential Income − Actual Collected) ÷ Potential Income) × 100
Example:
- Potential Rental Income: £100,000
- Actual Collected Rent: £90,000
Economic Vacancy Rate = ((£100,000 − £90,000) ÷ £100,000) × 100
= (£10,000 ÷ £100,000) × 100
= 10%
So, the Economic Vacancy Rate is 10%.
Pro Tip:
Include both unpaid rent and concessions when calculating for the best accuracy.
41. Tenant Turnover Rate
What it is:
The percentage of tenants leaving compared to the total tenant base in a period.
Why it matters:
- High turnover means frequent vacancies.
- Indicates tenant satisfaction or dissatisfaction.
- Impacts marketing and turnover costs.
- Affects community stability.
- Guides service and amenity decisions.
Objectives:
- Track tenant retention health.
- Identify turnover cost drivers.
- Improve lease renewal strategies.
- Compare performance across properties.
- Reduce vacancy and re-leasing losses.
Formula:
Turnover Rate (%) = (Number of tenants who Move-outs ÷ Total Units) × 100
Or
Turnover Rate (%) = (Number of tenants who Move-outs and replacements ÷ Total Units) × 100
Example:
In a given year, 15 tenants moved out of a property with 100 total units.
Turnover Rate = (15 ÷ 100) × 100 = 15%
So, the Turnover Rate is 15%.
Pro Tip:
Ask departing tenants why they left; insights can guide improvements.
42. Tenant Retention Rate
What it is:
The percentage of tenants who renew leases within a period.
Why it matters:
- High retention keeps occupancy and income stable.
- Reduces marketing and turnover costs.
- Shows tenant satisfaction levels.
- Helps forecast renewal needs.
- Keeps communities stable and desirable.
Objectives:
- Promote property stability.
- Measure service quality.
- Identify renewal success factors.
- Highlight effective engagement methods.
- Budget for improvements.
Formula:
Retention Rate (%) = (Leases Renewed ÷ Eligible Leases) × 100
Example:
Out of 60 leases that were up for renewal this year, 45 tenants renewed.
Retention Rate = (45 ÷ 60) × 100 = 75%
So, the Tenant Retention Rate is 75%.
Pro Tip:
Offer early renewal incentives to lock in tenants before market shifts.
Digital Marketing, SEO & PPC
- SEO to boost rankings and capture high-intent, AI-driven traffic
- Performance Marketing to run ROI-focused campaigns that convert
- Content Marketing to drive clicks, earn links, and build authority
43. Maintenance Cost per Unit
What it is:
The average amount spent on maintenance per unit over a period.
Why it matters:
- Helps control repair spending.
- Reveals aging or problem units.
- Enables budget forecasting.
- Impacts net income and tenant satisfaction.
- It can indicate maintenance efficiency.
Objectives:
- Track repair costs closely.
- Compare costs by unit types.
- Forecast maintenance budgets.
- Spot units needing upgrades.
- Optimise vendor or contractor usage.
Formula:
Maintenance Cost/Unit = Total Maintenance Costs ÷ Total Units
Example:
A property spent £25,000 on maintenance for 50 units this year.
Maintenance Cost per Unit = £25,000 ÷ 50 = £500
So, the average maintenance cost per unit is £500 per year.
Pro Tip:
Track routine vs. emergency repairs separately to better spot inefficiency.
44. Construction Cost per Square Foot
What it is:
Average cost to build or renovate per square foot.
Why it matters:
- Enables budgeting and cost planning.
- Helps compare contractor bids.
- Ensures the project stays on budget.
- Guides ROI calculations.
- Reveals construction economies of scale or waste.
Objectives:
- Benchmark local project costs.
- Manage budgets effectively.
- Compare building methods.
- Evaluate project feasibility.
- Support value-engineering decisions.
Formula:
Construction Cost/Sq Ft = Total Construction Cost ÷ Total Sq Ft
Example:
A building project costs £2,000,000 and covers 10,000 square feet.
Construction Cost per Sq Ft = £2,000,000 ÷ 10,000 = £200
So, the Construction Cost per Square Foot is £200.
45. Operating Expense Ratio (OER)
What it is:
Cost efficiency of property operations, calculated as the expense percentage relative to income.
Why it matters:
- Shows how much income is consumed by expenses.
- Enables expense control and efficiency.
- Helps benchmark with similar properties.
- Indicates areas of financial risk.
- Reflects operational stability.
Objectives:
- Measure cost-to-income efficiency.
- Benchmark expense performance.
- Identify rising cost areas.
- Guide cost-control strategies.
- Improve net operating income.
Formula:
OER (%) = (Operating Expenses ÷ Gross Operating Income) × 100
Example:
- Operating Expenses: £120,000
- Gross Operating Income (GOI): £400,000
OER = (120,000 ÷ 400,000) × 100 = 30%
So, the Operating Expense Ratio is 30%.
Portfolio & Market Metrics
46. Portfolio Value Growth
What it is:
The percentage increase (or decrease) in the total value of your real estate portfolio over time.
Why it matters:
- Shows how asset values are changing
- Reflects the success of your investment strategy
- Helps forecast borrowing power and equity
- Reflects market appreciation or redevelopment
- Supports performance reporting to stakeholders
Objectives:
- Measure the overall performance of your portfolio
- Compare against benchmarks or inflation
- Evaluate the impact of asset sales/purchases
- Inform long-term growth planning
- Identify strong or weak asset classes
Formula:
Portfolio Value Growth (%) = ((Current Portfolio Value – Initial Portfolio Value) ÷ Initial Portfolio Value) × 100
Where:
Current Portfolio Value = Total market value of all properties/assets in your portfolio today
Initial Portfolio Value = Value of the portfolio at the starting point (e.g., 12 months ago)
Example:
Initial Value (2023) = £5,000,000
Current Value (2025) = £6,250,000
Portfolio Growth = ((6,250,000 – 5,000,000) ÷ 5,000,000) × 100
= (1,250,000 ÷ 5,000,000) × 100
= 25%
Your portfolio grew by 25% over that period.
Marketing Research & Strategy
We help you understand your market and build smart strategies to attract more customers and grow faster.
- Detailed research into your competitors, customers, and market
- Custom marketing and growth plans that drive real results
- Clear action steps to increase traffic, leads, and sales
ADWORDS ROI
Cut Ad spend
47. Real Estate Demand Growth
What it is:
The change in market demand over time—measured by indicators of buyer intent and interest, such as property enquiries, search volume, mortgage applications, and ultimately, sales volume.
While sales and listings under contract reflect demand being met, early signals like web traffic or viewing requests are often more valuable for forecasting.
Why it matters:
- Indicates rising or declining buyer activity
- Guides marketing and acquisition strategies
- Helps with timing expansion or divestment decisions
- Provides early signals of market shifts
- Supports long-term strategic planning and positioning
Objectives:
- Track shifts in buyer or tenant demand
- Forecast potential changes in pricing or occupancy
- Adapt budgets according to demand cycles
- Align marketing efforts with current interest levels
- Identify emerging markets or early signs of downturns
Formula:
Demand Growth (%) = ((Current Period Demand – Previous Period Demand) ÷ Previous Period Demand) × 100
Where:
Demand can be measured by:
- Number of property enquiries
- Volume of mortgage applications
- Number of listings sold or under offer
- Buyer registrations or lead submissions
- Online search volume and website traffic
- Viewing requests or appointment bookings
Example:
Property inquiries in Q1 = 2,000
Inquiries in Q2 = 2,600
Demand Growth = ((2,600 – 2,000) ÷ 2,000) × 100
= (600 ÷ 2,000) × 100
= 30%
30% increase in real estate demand quarter-over-quarter.
48. Payback Period
What it is:
The number of years it takes for net cash flow to recover the original investment.
Why it matters:
- Shows how quickly investment returns capital
- Helps evaluate risk and liquidity
- Useful for cash-oriented investors
- Aids in comparing fast vs. slow payback deals
- Supports strategic exit planning
Objectives:
- Assess time-to-break-even
- Compare multiple investment options
- Align expectations with investor goals
- Monitor long-term investment pacing
- Guide decisions on refinancing or selling
Formula:
Payback Period = Initial Investment ÷ Annual Net Cash Flow
Where:
Initial Investment = Total upfront capital (purchase price + closing costs + renovation, etc.)
Annual Net Cash Flow = Yearly cash flow after all expenses and debt service (but before taxes)
Example:
Initial Investment = £200,000
Annual Net Cash Flow = £25,000
Payback Period = £200,000 ÷ £25,000 = 8 years
You’ll recover your full investment in 8 years.
49. YoY Variance in Avg Sold Price
What it is:
Year-over-year percentage change in the average sale price of properties.
Why it matters:
- Tracks market pricing trends
- Indicates appreciation or cooling
- Helps price assets strategically
- Supports competitive analysis
- Guides investment timing
Objectives:
- Track annual price movements
- Inform the valuation strategy
- Compare submarkets or segments
- Spot overheated or undervalued areas
- Forecast future pricing levels
Formula:
YoY Variance (%) = ((Avg Sold Price This Year – Avg Sold Price Last Year) ÷ Avg Sold Price Last Year) × 100
Where:
Avg Sold Price This Year = Average sale price of properties in the current year
Avg Sold Price Last Year = Average sale price in the previous year
Example:
2024 Avg Sold Price = £320,000
2023 Avg Sold Price = £300,000
YoY Variance = ((320,000 – 300,000) ÷ 300,000) × 100
= (20,000 ÷ 300,000) × 100
= 6.67%
The average sold price increased by 6.67% YoY.
50. Absorption Rate (Sales Ratio)
What it is:
The percentage of available listings sold within a specific period. It indicates how quickly homes are being absorbed from the market and reflects real-time buyer activity.
Why it matters:
- Shows whether it’s a seller’s or buyer’s market
- Measures how fast inventory is turning over
- Informs short-term pricing and marketing strategies
- Supports timing decisions for buying, selling, or investing
- Acts as a snapshot of market liquidity and competitiveness
Objectives:
- Assess inventory turnover speed
- Define current market pressure (supply vs. demand)
- Guide dynamic pricing adjustments
- Forecast near-term market absorption
- Compare sales activity across locations or asset classes
Formula:
Absorption Rate (%) = (Number of Homes Sold in a Period ÷ Number of ACtive Listings in the Same Period) * 100
Where:
- Homes Sold = Number of properties that closed during the chosen time frame (e.g., month)
- Active Listings = Number of homes listed for sale during that same period
Related Metric: Months of Supply
What it is:
The number of months it would take to sell all current listings at the current pace of sales. It’s a critical indicator of market balance.
Why it matters:
- Helps determine if the market favours buyers or sellers
- Fewer months = stronger seller’s market
- More months = stronger buyer’s market
- Provides context for pricing strategy, urgency, and supply planning
Months of Supply = Number of Active Listings ÷ Average Monthly Sales
Digital Marketing, SEO & PPC
- SEO to boost rankings and capture high-intent, AI-driven traffic
- Performance Marketing to run ROI-focused campaigns that convert
- Content Marketing to drive clicks, earn links, and build authority
51. Equity‑to‑Value Ratio
What it is:
The percentage of the property value that is owned outright, i.e., not financed.
Why it matters:
- Shows equity buffer and leverage level
- Helps manage refinancing or loan terms
- Supports risk assessment
- Impacts borrowing capacity
- Reflects financial health
Objectives:
- Measure equity built into assets
- Guide recasting/refinancing decisions
- Reduce over-leverage risk
- Compare leverage across the portfolio
- Plan future investments or dividends
Formula:
Equity-to-Value Ratio (%) = (Equity in Property ÷ Current Market Value of Property) × 100
Where:
Equity = Current Market Value – Outstanding Loan Balance
Current Market Value = The property’s current appraised or estimated value
Example:
Current Market Value = £500,000
Outstanding Loan = £350,000
Equity = £150,000
Equity-to-Value Ratio = (150,000 ÷ 500,000) × 100 = 30%
You currently own 30% of the property’s value outright.
52. Percentage of Presale Sold
What it is:
The percentage of new units sold prior to completion in a development.
Why it matters:
- Signals project confidence and early demand
- Helps secure construction financing
- Reduces the risk of unsold inventory
- Guides project scaling
- Supports pricing and marketing decisions
Objectives:
- Measure pre-completion sales success
- Inform finance planning
- Adjust construction schedules
- Refine marketing strategies
- Build buyer confidence
Formula:
Percentage of Presale Sold (%) = (Number of Units Sold in Presale ÷ Total Units Available for Presale) × 100
Where:
Units Sold in Presale = Number of properties sold before construction or project completion
Total Units Available for Presale = The total inventory released in the presale phase
Example:
Total Units Available for Presale = 100
Units Sold = 65
Presale Sold % = (65 ÷ 100) × 100 = 65%
65% of the presale inventory is sold, indicating strong early demand.
53. Real Estate Market Share
What it is:
Your company’s sales (or listings) as a percentage of the total local market.
Why it matters:
- Shows competitive strength and growth
- Reveals if you're gaining or losing ground
- Guides strategic positioning and marketing
- Helps set realistic sales targets
- Signals shift in industry dominance
Objectives:
- Measure market presence annually
- Benchmark against rivals
- Evaluate strategy effectiveness
- Set share-gain or retention goals
- Support investment and growth decisions
Formula:
Market Share (%) = (Your Sales Volume ÷ Total Market Sales Volume) × 100
Where:
Your Sales Volume = The total value (or number) of transactions your agency, team, or agent closed in a defined area/time period
Total Market Sales Volume = Total value (or number) of all transactions in the same market area and timeframe
Example:
If your agency sold £25 million worth of property in a region where £250 million total property was sold:
Market Share = (25,000,000 ÷ 250,000,000) × 100 = 10%
Your business holds 10% market share in that location.
54. YoY Variance in Sold per Sq Ft
What it is:
Annual change in the average sale price per square foot.
Why it matters:
- Tracks value changes independent of size
- Helps price listings accurately
- Compare performance across neighborhoods
- Supports market trend analysis
- Guides investor location selection
Objectives:
- Monitor per‑sq‑ft pricing trends
- Refine pricing strategies
- Evaluate local market shifts
- Compare asset types or locations
- Support valuation and investment plans
Formula:
YoY Variance (%) = ((Avg Sold Price/Sq Ft This Year – Avg Sold Price/Sq Ft Last Year) ÷ Avg Sold Price/Sq Ft Last Year) × 100
Where:
Avg Sold Price/Sq Ft = Total sale price of all properties sold divided by the total square footage of all properties sold during a year.
Useful for tracking real estate value trends normalised across property sizes
Example:
2024 Sold Price/Sq Ft = £320
2023 Sold Price/Sq Ft = £300
YoY Variance = ((320 – 300) ÷ 300) × 100
= (20 ÷ 300) × 100
= 6.67%
Sold price per square foot increased by 6.67% YoY
Marketing Research & Strategy
We help you understand your market and build smart strategies to attract more customers and grow faster.
- Detailed research into your competitors, customers, and market
- Custom marketing and growth plans that drive real results
- Clear action steps to increase traffic, leads, and sales
ADWORDS ROI
Cut Ad spend
55. Average Mortgage Rate
What it is:
The current average interest rate offered by lenders for long-term mortgages. This figure reflects prevailing market conditions and directly impacts buyer affordability and investor strategies.
Why it matters:
- Determines buyers’ purchasing power
- Influences sales volume and affordability
- Guides timing for buyer-focused campaigns
- Affects the financing strategy for investors
- Reflects broader economic conditions
Objectives:
- Track interest rate trends
- Inform buyers’ affordability
- Align marketing strategies with rate cycles
- Compare financing offers for clients
- Forecast market demand based on rates
Understanding the Average Mortgage Rate:
Unlike internal business metrics, the average mortgage rate typically refers to public market averages published by financial institutions or aggregators. These are often based on:
- Simple averages of quoted rates from multiple lenders
- Median rates reported for standard loan types (e.g. 30-year fixed, 15-year fixed)
- Survey-based results from banks, brokers, or financial platforms
Conceptual Formula (Market Average):
Average Mortgage Rate (%) = Sum of Quoted Interest Rates ÷ Number of Lenders Surveyed
Note: This is a simplified representation. In practice, institutions like the Bank of England, UK Finance, or private aggregators compile these figures using lender surveys and may apply weightings based on volume or loan characteristics.
Risk Metrics
56. Loan‑to‑Value Ratio (LTV)
What it is:
The percentage of the property value that is financed by the loan. For example, a ₹8 crore property with a ₹6 crore loan has an LTV of 75%.
Why it matters:
- Lenders use it to judge risk—lower LTV means less lender risk
- Influences loan approval and interest rates
- Helps borrowers understand equity and buffer levels
- Affects the need for mortgage insurance
- Guides refinancing and equity planning
Objectives:
- Evaluate loan risk and structure
- Negotiate better loan terms
- Plan equity contributions
- Compare different financing options
- Protect against market value drops
Formula:
LTV (%) = (Loan Amount ÷ Appraised Property Value) × 100
Example:
Loan Amount = £240,000
Appraised Property Value = £300,000
LTV = (240,000 ÷ 300,000) × 100 = 80%
This means the lender is financing 80% of the property’s value, and you’re contributing 20% as equity/down payment.
Why LTV Matters:
- Lower LTV = Lower risk = Better interest rates & terms
- Higher LTV = Higher risk = May require:
- Mortgage insurance
- Higher rates
- Stricter lending conditions
57. Debt Service Coverage Ratio (DSCR)
What it is:
A measure of a property’s ability to cover its annual debt payments with its operating income, shown as a ratio.
Why it matters:
- Ensures income can support loan obligations
- Helps spot income shortfalls early
- Used to structure the loan amount and terms
- Indicates a financial cushion for unexpected costs
Objectives:
- Measure debt sustainability
- Evaluate investment feasibility
- Guide debt structuring and terms
- Monitor changes in income or payments
- Identify the need for lease or rent adjustments
Formula:
DSCR = Net Operating Income (NOI) ÷ Total Debt Service
Where:
Net Operating Income (NOI) = Income from property after operating expenses (before debt or tax)
Total Debt Service = Annual loan payments (principal + interest)
Example:
NOI = £60,000
Annual Debt Service = £45,000
DSCR = 60,000 ÷ 45,000 = 1.33
This means the property generates 1.33x the income needed to cover its debt — a healthy ratio.
58. Debt‑to‑Equity Ratio
What it is:
This ratio shows how much of your investments are financed by borrowed money (debt) versus your own capital (equity). It’s a key indicator of financial leverage and risk exposure.
Why it matters:
- Measures how heavily your business relies on debt financing
- Higher ratios suggest greater financial risk—but potentially higher returns
- Helps balance borrowing with available equity
- Useful for comparing risk across multiple properties or portfolios
- Informs strategic decisions around lending, refinancing, or reinvestment
Objectives:
- Monitor leverage and financial risk levels
- Maintain a healthy balance between debt and equity
- Compare capital structure across assets or businesses
- Guide debt repayment and refinancing strategies
- Support long-term financial planning and investment readiness
Formula:
Debt-to-Equity Ratio = Total Liabilities ÷ Total Equity
Where:
- Total Liabilities = All outstanding financial obligations, including loans, mortgages, credit facilities, and other debts
- Total Equity = The value of shareholders’ (or owner’s) equity as reported on the balance sheet. This includes:
- Contributed/share capital
- Retained earnings
- Other comprehensive income
For a single property, equity can be estimated as property value – debts, but in a broader business or portfolio context, Total Equity reflects the owners’ residual claim on all assets after liabilities are paid.
Example:
Total Liabilities = £600,000
Total Equity = £400,000
Debt-to-Equity Ratio = 600,000 ÷ 400,000 = 1.5
This means you have £1.50 of debt for every £1 of equity.
58. Debt‑to‑Equity Ratio
What it is:
It’s a measure of how easily your property’s Net Operating Income (NOI) can cover its annual interest payments.
It shows whether your cash flow is strong enough to service debt, without putting your business under pressure.
Why it really matters:
- Lenders look at this ratio first when assessing your financial health
- A low ratio = red flag for financial stress or over-leveraging
- A high ratio = strong solvency, and gives you room to refinance, reinvest, or scale safely
- Helps you avoid interest-to-income mismatches that can silently erode profitability
Objectives:
- Ensure your interest payments are covered — comfortably
- Detect early signs of debt-related financial strain
- Support smarter decisions on rent pricing, cost-cutting, or refinancing
- Track overall debt health over time, especially in rising-rate environments
Formula:
Interest Coverage Ratio = Net Operating Income (NOI) ÷ Annual Interest Expense
Where:
- NOI = Total rental/property income minus operating expenses (before debt service)
- Interest Expense = Annual interest on loans (excluding principal repayments)
Example:
- NOI = £75,000
- Annual Interest = £25,000
Interest Coverage Ratio = 75,000 ÷ 25,000 = 3.0
That means you’re earning 3x what you need to cover loan interest — a strong position in the eyes of banks and investors.
Mindset & Founder-Led Metrics
These metrics won’t show up in your CRM or dashboards, but they quietly decide whether the 59 you do track actually drive growth. Because it’s your decisions, clarity, and how you spend your time that ultimately determine whether you scale or stall.
60. Mindset & Founder‑Led Metrics
These capture the intangible yet critical dimensions of leadership that shape performance from the top down.
Beliefs, discipline & coaching
A strong, growth-oriented mindset sets the cultural and operational tone for the entire business.
Founders influence clarity, focus, and resilience—especially during uncertain or volatile market conditions. Their personal discipline often becomes the benchmark for the entire organisation.
Leadership effectiveness indicators
Rather than focusing solely on output KPIs, leadership mindset can be reflected in more nuanced indicators, such as:
- Speed and quality of decision-making
- Team morale and engagement
- Frequency of innovation or experimentation
- Uptake of strategic initiatives or changes
- Clarity and alignment during team communications
These serve as proxies for how effectively a founder’s mindset is being translated into the day-to-day functioning of the business.
Founder-led behavioural benchmarks
Founders should actively track and uphold their own leadership standards:
- Personal consistency (e.g. daily planning, energy management, deep work habits)
- Participation in mentorship, mastermind groups, or ongoing learning
- Regular reflection on decisions, blind spots, and leadership growth
- Intentional culture-building activities
Why it matters:
A disciplined, self-aware founder drives consistency, strategic behaviour, and team accountability. Without a stable mindset at the helm, even the best business metrics can fluctuate unpredictably—because your business will never outperform your psychology.
61. Time Spent in High‑Value Activities
This metric tracks how much of your weekly work is devoted to activities that directly contribute to revenue generation,” or “activities that are essential for securing revenue.”
High‑value activities include lead outreach, listing presentations, client meetings, showings, negotiation, and strategy sessions.
Low‑value tasks include administrative chores, data entry, routine email, and paperwork. Today’s top agents leverage tech and assistants to offload routine tasks, freeing up much more of their own time for high‑value focus.
Why it matters: Time is the only non-renewable resource in the business. The more hours you invest in activities that directly generate client value and income, the faster your business grows. And consistent tracking helps spot drift into low-value work.
Digital Marketing, SEO & PPC
- SEO to boost rankings and capture high-intent, AI-driven traffic
- Performance Marketing to run ROI-focused campaigns that convert
- Content Marketing to drive clicks, earn links, and build authority
How to Actually Use These Metrics to Grow Your Business
Tracking metrics is just the starting point. Growth happens when you turn numbers into actions.
Here’s a simple, step-by-step way to make your metrics work for you:
Step 1: Find What’s Holding You Back
Not all numbers matter all the time. Ask yourself:
- “Where are we stuck right now?”
Examples:
- Not getting enough leads? → Look at Lead Metrics
- Getting leads but not clients? → Check Funnel Metrics
- Selling a lot but not making much profit? → Review Financial KPIs
- Big team, low results? → Look at Agent Productivity
- Struggling to grow? → See Strategic Growth Metrics
Focus on the 2–3 areas that are slowing you down.
Step 2: Set Clear, Real Goals (Not Vanity Ones)
Don’t just say:
- “We want to grow revenue.”
Say:
- “We’ll raise average commission per agent from £7,500 to £9,000 by Q4 by improving pricing and offering premium services.”
Make sure your goals include:
- Time (by when?)
- Owner (who’s responsible?)
- Action (what will they do?)
Step 3: Build a Simple Dashboard
Spreadsheets don’t help if no one looks at them.
Use easy tools like:
- Google Looker Studio (free + flexible)
- Databox
- Airtable with automations
- ClickUp Dashboards (if that’s your HQ)
Track:
- Monthly results → Sales, revenue per client
- Quarterly big-picture metrics → Market share, customer value
Tip: Use color codes: Green (good), Yellow (watch), Red (fix now).
Step 4: Make It a Monthly Habit
This is where most teams fall behind.
Block some specific time each month to check your numbers.
Ask:
- What went up or down?
- Why?
- What will we do about it this week?
Numbers only help when they lead to decisions.
Step 5: Link Metrics to Rewards
If you want your team to care, tie the numbers to something they value.
Examples:
- Agents are rewarded for fast sales or high commissions
- Marketers get bonuses for low cost per lead and high conversion rates
- Ops team recognised for faster onboarding and fewer mistakes
Reminder: What you track improves. What you reward improves faster.
So… Let’s Wrap Up
Tracking real estate metrics isn’t just about crunching numbers—it’s about having clarity, making smarter decisions, and setting your business up for real growth.
The most successful real estate companies don’t rely on gut feeling. They rely on data. When you consistently measure the things that actually impact your leads, conversions, profits, and team performance, you move from guesswork to strategy.
These numbers act like a GPS for your business, helping you know where you are, what’s working, and where to go next.
Done right,
They lead to steady growth, better margins, and a serious edge over the competition. If you want predictable, scalable growth, start tracking what really matters. Because in real estate, what you measure, multiplies.


